Skip to content
TutorialsForExcel

TutorialsForExcel

Excel Guides and Templates

  • Home
  • How to Guides
  • Functions and Formulas
  • Free Excel Templates

Tag: pivot chart

How to use Excel Slicers with PivotTables

Posted on January 8, 2019February 7, 2019 by Elora K.
Excel Slicers

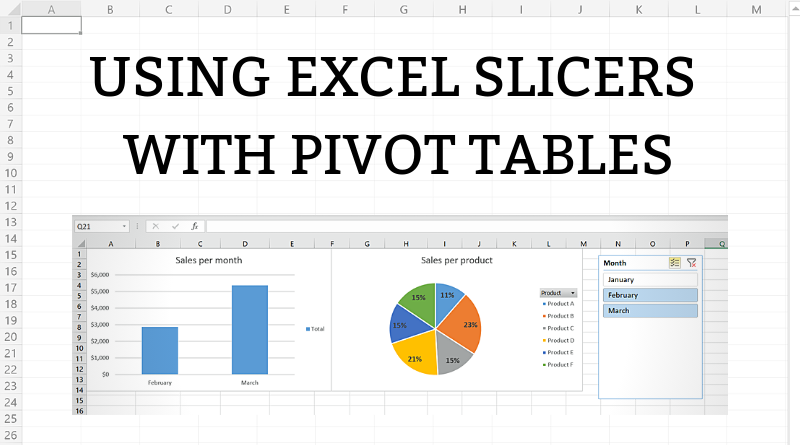
A slicer in Excel is a user-friendly tool which allows to filter pivot tables. It is an advanced version of the standard filter option available for pivot tables. Apart from filtering a single pivot table, slicers are often used in dashboards for filtering several pivot tables and charts together. In this article, we will cover… Read more How to use Excel Slicers with PivotTables

How to Make a Histogram with Pivot Table

Posted on December 18, 2018February 7, 2019 by Elora K.

A histogram is a chart presentation of data grouped in equal intervals. In this step by step article, we will show you how to make a pivot chart histogram in Excel using pivot table as a data source. A histogram is often used to present the number of students with a number of points in… Read more How to Make a Histogram with Pivot Table

Skip to footer

Newsletter

Get all our latest templates and Excel tips straight to your inbox.

Recent Posts

  • The BETADIST Function: Syntax and Examples
  • The BITOR Function: Syntax and Examples
  • The BIN2HEX Function: Syntax and Examples
  • The COUNT Function: Syntax and Examples
  • How to Freeze Rows and Columns in Excel

Find an Article

Tags

#NUM! #VALUE! 2019 excel template AND bcg matrix BIN2HEX boston matrix boston matrix template CHAR chart clustered column compare CONCAT CONCATENATE conditional formatting consignment invoice duplicates formula function function examples histogram IFERROR investment invoice IRR irregular intervals kpi MATCH math function matrix template OR pivot chart pivot table rail RANK rolling action item list SEARCH slicer sort sort & filter sum template to do list vlookup XIRR
Proudly powered by WordPress | Theme: Yocto by Humble Themes.