This is a quick tutorial on how to freeze rows in Excel. I know that most of you don’t need pointers with this, but if you’re new to Excel, keep reading to get familiar with the basics. This feature can come in handy when you have an Excel document that is so long that you… Read more How to Freeze Rows and Columns in Excel
Category: Excel Tips and Tricks
How to Unhide Columns in Excel
It’s easy to hide columns in Excel but not always that easy to reveal them. Depending on what columns or rows you have hidden, there are four different options to bring them back again. 1. Unhide All Columns This is the easiest option for you if you want to unhide all columns in your sheet.… Read more How to Unhide Columns in Excel
8 Most Common VLOOKUP Errors
Excel’s VLOOKUP function is a powerful and helpful function that can help filter your data down to a desired item. It is sort of a combination of database functionality and search engine ease to refine your spreadsheet’s content to some given search item. However, VLOOKUP for all of its powerful abilities can sometimes be frustratingly… Read more 8 Most Common VLOOKUP Errors
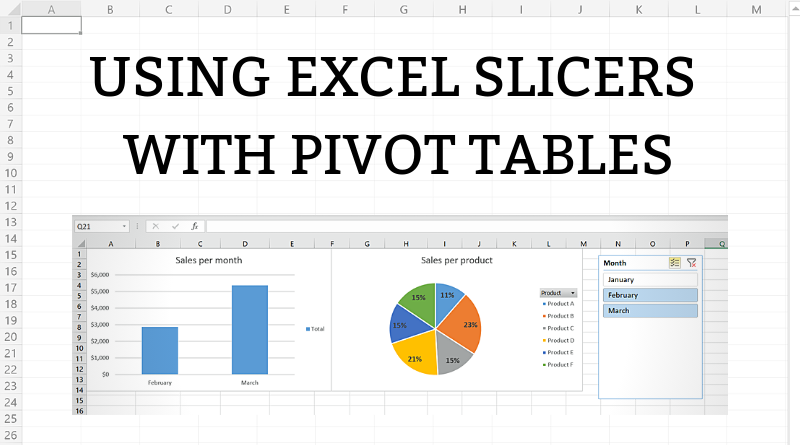
How to use Excel Slicers with PivotTables
A slicer in Excel is a user-friendly tool which allows to filter pivot tables. It is an advanced version of the standard filter option available for pivot tables. Apart from filtering a single pivot table, slicers are often used in dashboards for filtering several pivot tables and charts together. In this article, we will cover… Read more How to use Excel Slicers with PivotTables
Best Uses for Conditional Formatting in Excel
Conditional formatting is a very useful Excel functionality that helps us visualize data based on certain criteria. In this tutorial we will cover some of the best uses for it and show you how to create your own Conditional Formatting rules using Excel formulas. Topics covered in this tutorial: Creating a conditional formatting rule Comparing… Read more Best Uses for Conditional Formatting in Excel
How to Make a Histogram with Pivot Table
A histogram is a chart presentation of data grouped in equal intervals. In this step by step article, we will show you how to make a pivot chart histogram in Excel using pivot table as a data source. A histogram is often used to present the number of students with a number of points in… Read more How to Make a Histogram with Pivot Table